1
National Wilderness Preservation System (NWPS) of the United States
Land use changes in areas surrounding wilderness
2
There are 714 wilderness areas within the NWPS in the lower 48 states of the United States.
Wilderness areas are shown in green with other public lands shown in light-grey.
3
Many wilderness areas are within a 3-hour drive (150 miles) of large U.S. cities
Cities with populations >500,000 are shown here
4
Because land use change around wilderness areas can alter the preservation and character of wilderness by influencing ecological processes, natural habitat, wildlife populations, and recreational experiences, we used the change in human population during 1990 to 2000 and to 2010 within 150 miles of each of these cities to assess the influence of land use change on wilderness areas.
We chose the distance of 150 miles because this distance can be traveled within a day to visit nearby wilderness areas. The gray circles show the 150 mile distance around each city.
The shading of each 150-mile circle shows the percent increase in human population in each city during 1990 to 2000 (10 years)
Percent Increase
6
The shading here shows the percent increase in human population in each city during 1990 to 2010 (20 years)
Percent Increase
7
The cities that had a >60% increase in human population between 1990 and 2010 were Tucson, Phoenix, and Las Vegas.
For example, in Phoenix, Arizona, the human population increased by 73%, which represents 2.5 million more people between 1990 and 2010.
8
Las Vegas, Nevada experienced the greatest increase during this period
The population increased by 138% from 1990 to 2010
9
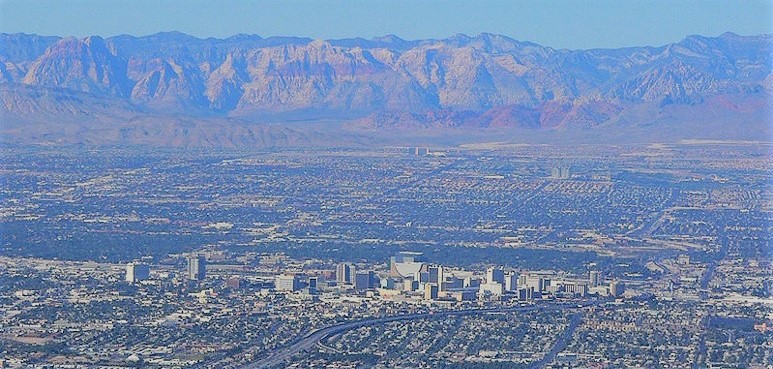
Many Wilderness areas surround Las Vegas.
The large increase in population has implications for the wilderness areas surrounding Las Vegas. In the image below you can see the Las Vegas strip in the foreground and the La Madre and Rainbow Mountain wilderness areas visible in the background.
10
By changing our perspective from centered on cities to centered on wilderness areas, we can assess how much of the land use change has occurred within 20 km (12.4 miles) of wilderness areas.
This new perspective, lets us view the changes occuring in a 20 km buffer around wilderness areas.
11
Using census data, we can see how the housing density has changed from 1990 to 2010 within 20 km of wilderness areas near Las Vegas. The 1990 housing density is shown here.
1990 housing density (housing units/square mile)
12
Within 20 km of the wilderness areas surrounding Las Vegas, 429,390 housing units have been added from 1990 - 2010. This represents an increase of 396%.
2010 housing density (housing units/square mile)
13
We can also model how development will change over time.
Here is the predicted extent of development for 2020 in yellow.